
Most businesses look at total website traffic and assume it reflects real market interest.
But, if you only supply to certain countries, a large portion of that traffic may be irrelevant.
Google Analytics (GA4) allows you to see website traffic by country and filter reports to focus only on visitors from the countries you actually sell to. When you do this properly, you often discover that your real conversion rate, engagement levels, and commercial performance look very different from your headline numbers.
This guide shows you:
If you want clearer, commercially meaningful analytics rather than inflated vanity metrics, this is the process to follow, if you use Google Analytics.
Many websites receive traffic from countries they don’t operate in or is traffic that they don’t want to skew their data.
For example:
If you don’t filter by country:
Filtering analytics by the countries you actually supply to removes that distortion.
Before filtering, begin broad.
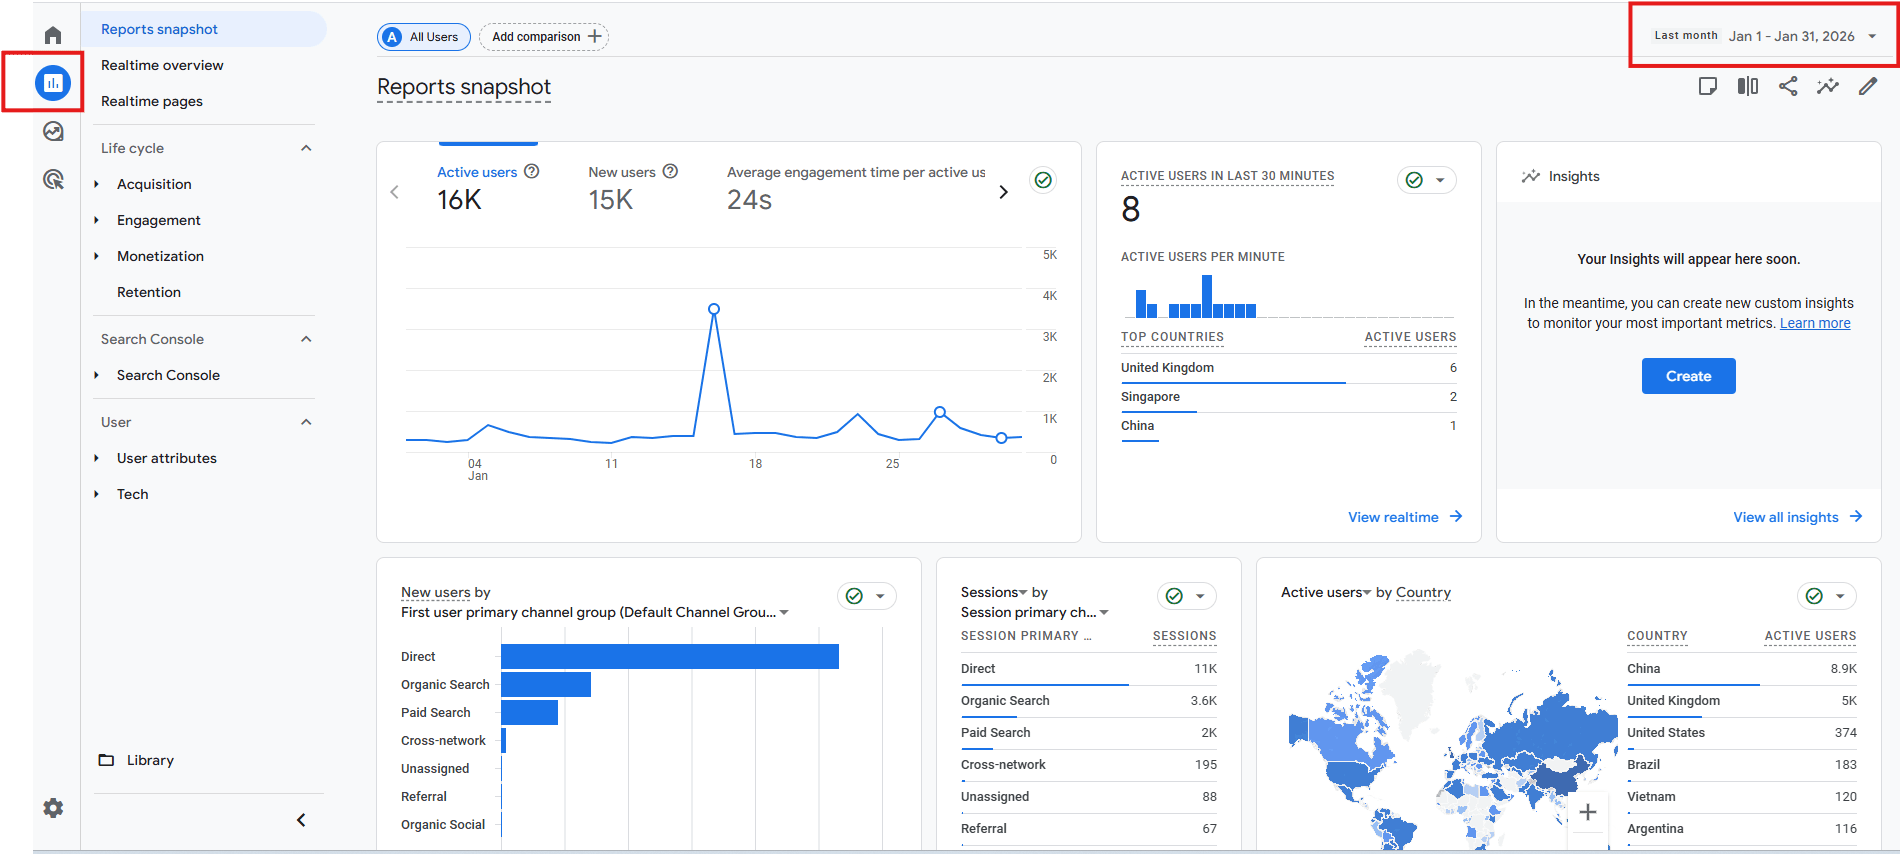
At this stage, you are seeing:
This is your baseline.
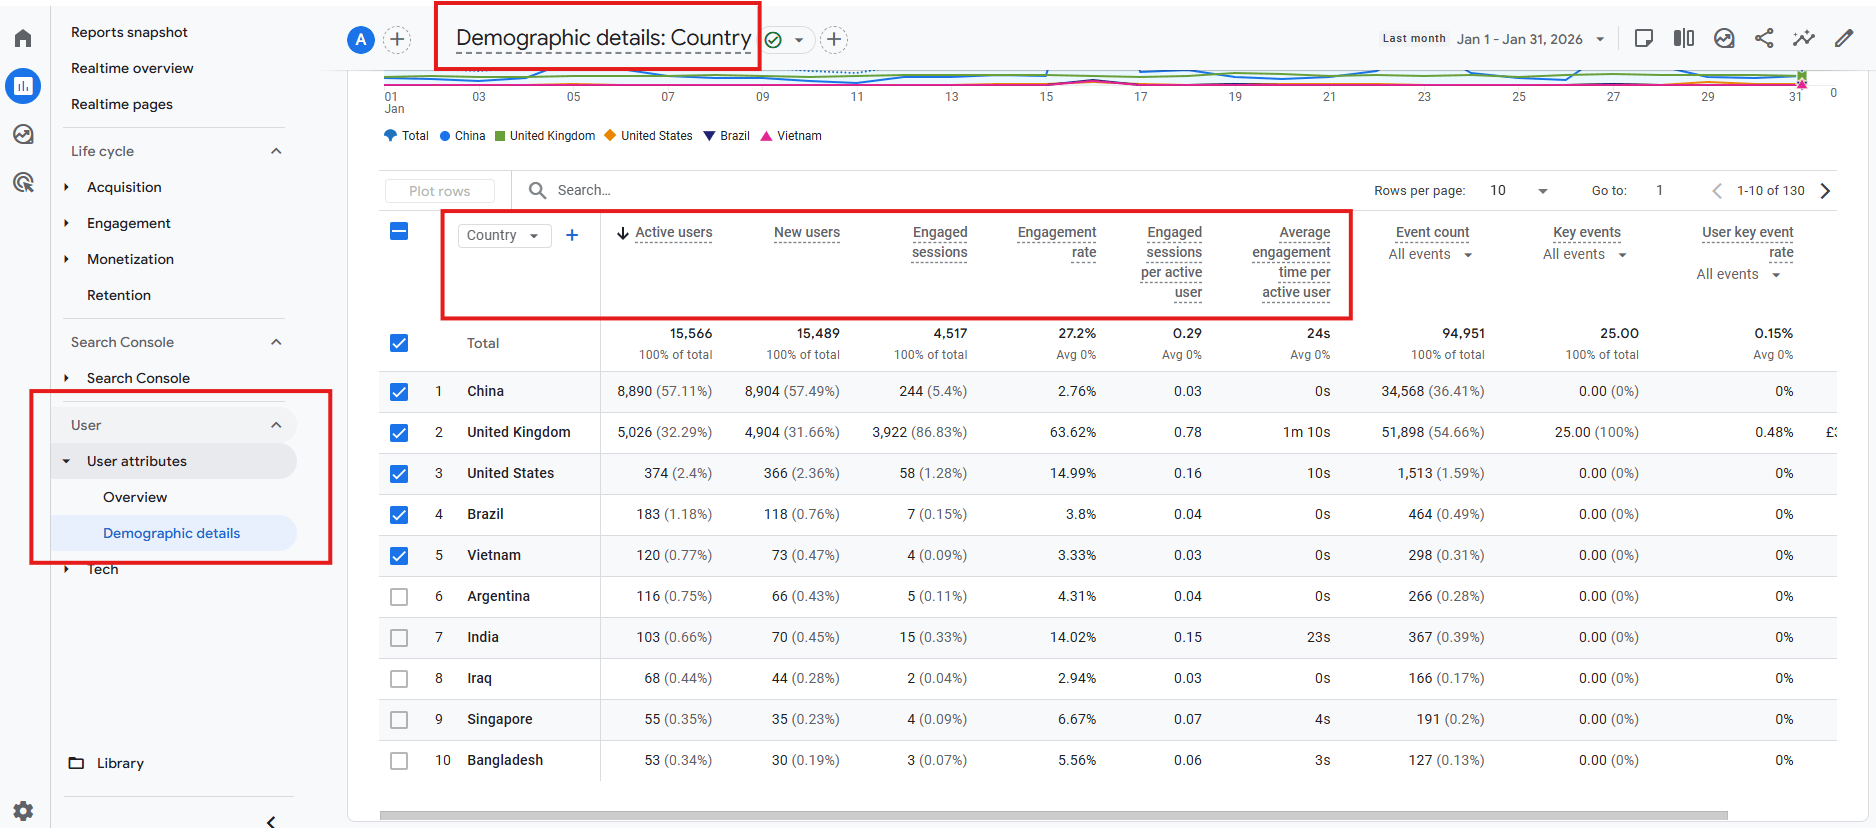
If needed, change the primary dimension to Country.
You will now see:
Focus on:
This is where patterns begin to appear.
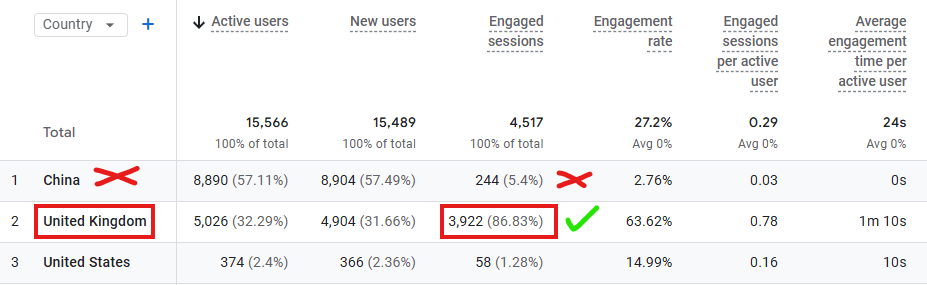
In this example, for a business that targets UK only, 86.83% of their visitors were engaged, but they also have huge numbers of China visitors who:
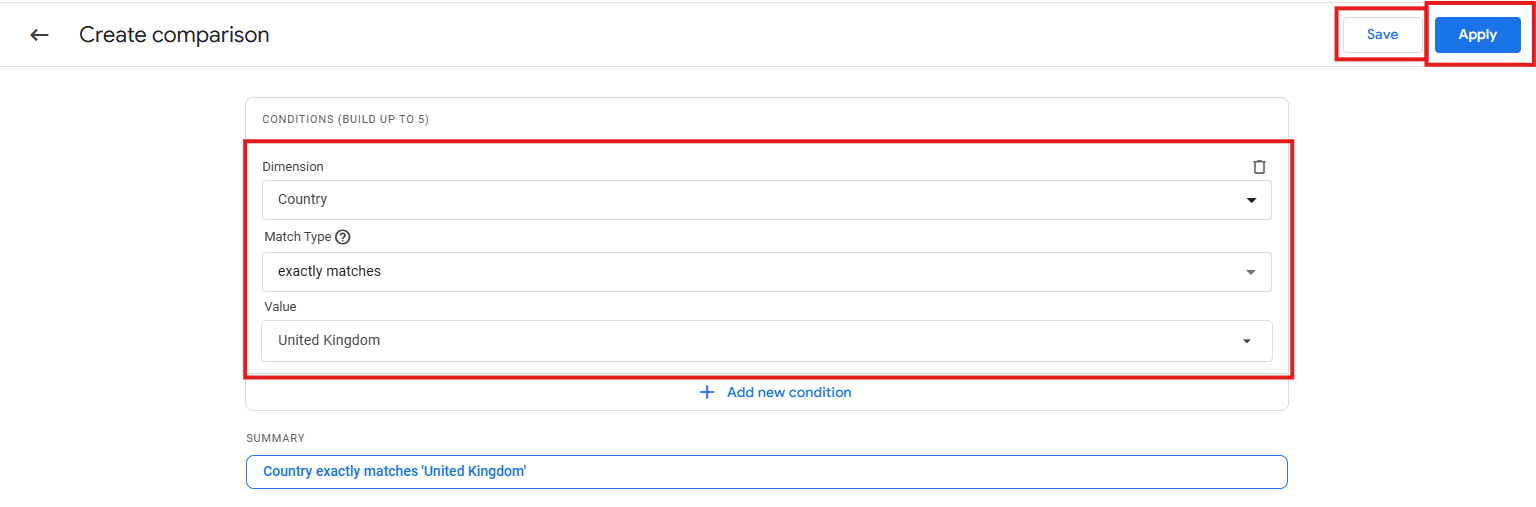
Now you need to add a country filter

Click Apply.
Your report now shows only visitors from that country.

Once filtered, you will notice:
That’s a good thing – it means that you now have a refined picture of how people in your target countries have engaged with your website.
Next it’s time to focus on how many of those refined visitors got to important pages – for example, your product or service pages …
Seeing broad country-level data is useful, but the real insights come when you combine geography with page-level behaviour.
Most businesses want to get a clearer picture of why they’re not selling more of what they offer. Filtering analytics data down to only visitors from countries of interest allows you to do that.
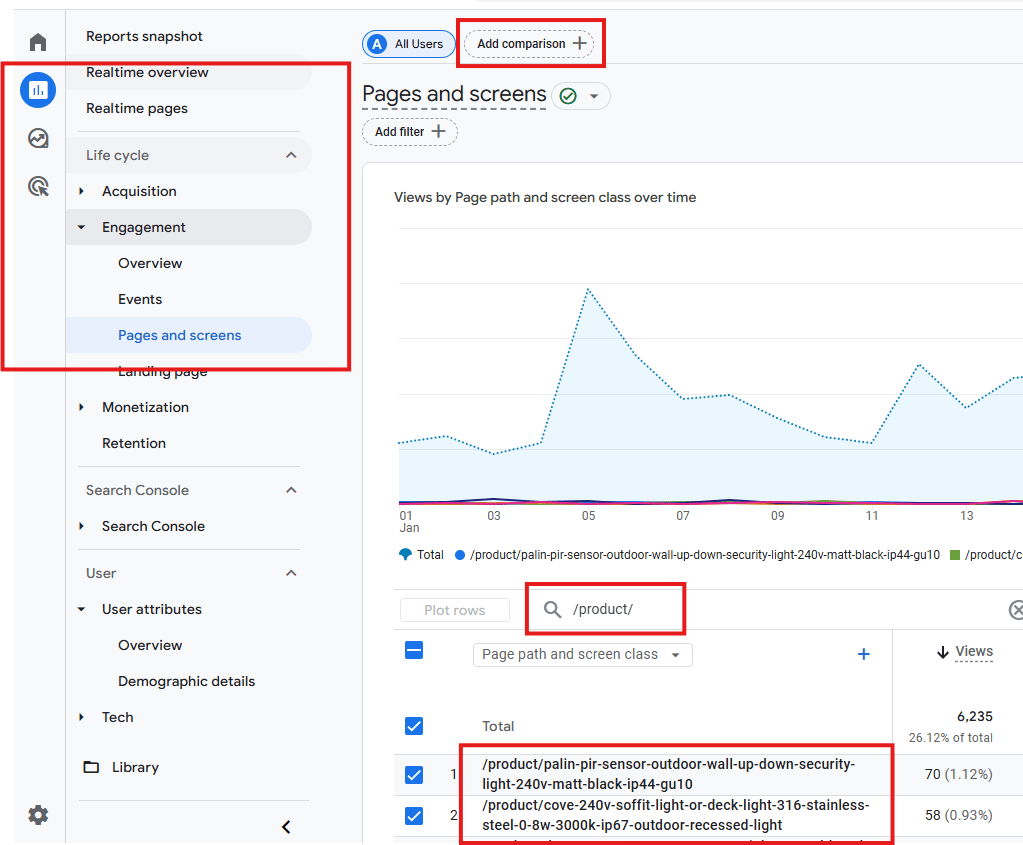

Your view will then show you those page urls with All Users plus also the country/countries that you filtered by. This will show you how many people within your target area got to those pages (vs everyone who got there).
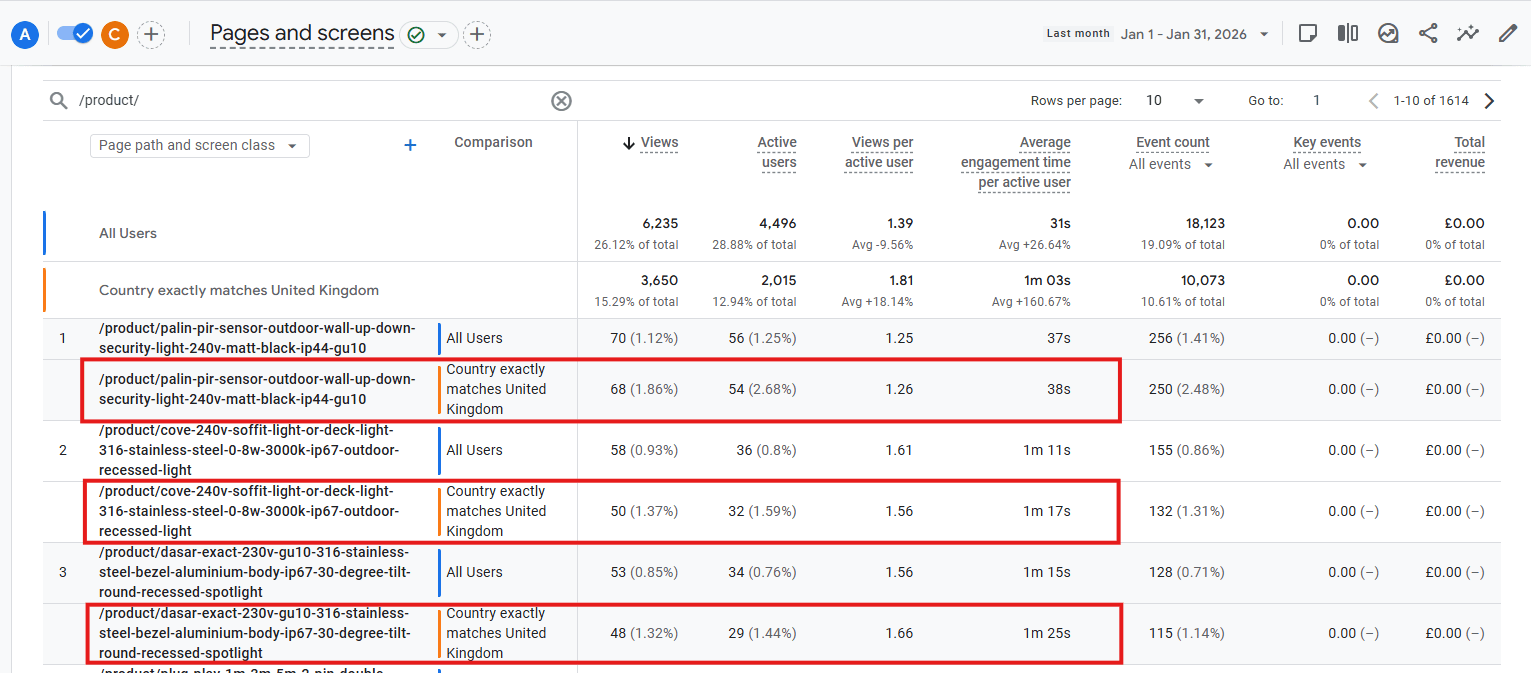
You are now able to compare visits to each page – purely from people in your target location(s) – to the levels of sales or enquiries you had related to relevant visits to those pages.
That’s useful on a monthly basis and even more telling when you expand to a longer time period and think about each product or service. If the enquiry levels or sales are particularly low vs the visitors then you’ll know you have much to achieve with your website strengthening (and sometimes need to fix marketing that’s bringing the wrong people to your website pages).
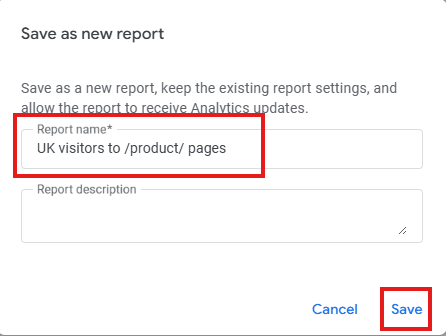
You now have a report that would be useful for you to quickly access in the future, instead of going through all these steps afresh.
Here’s how to save your report:


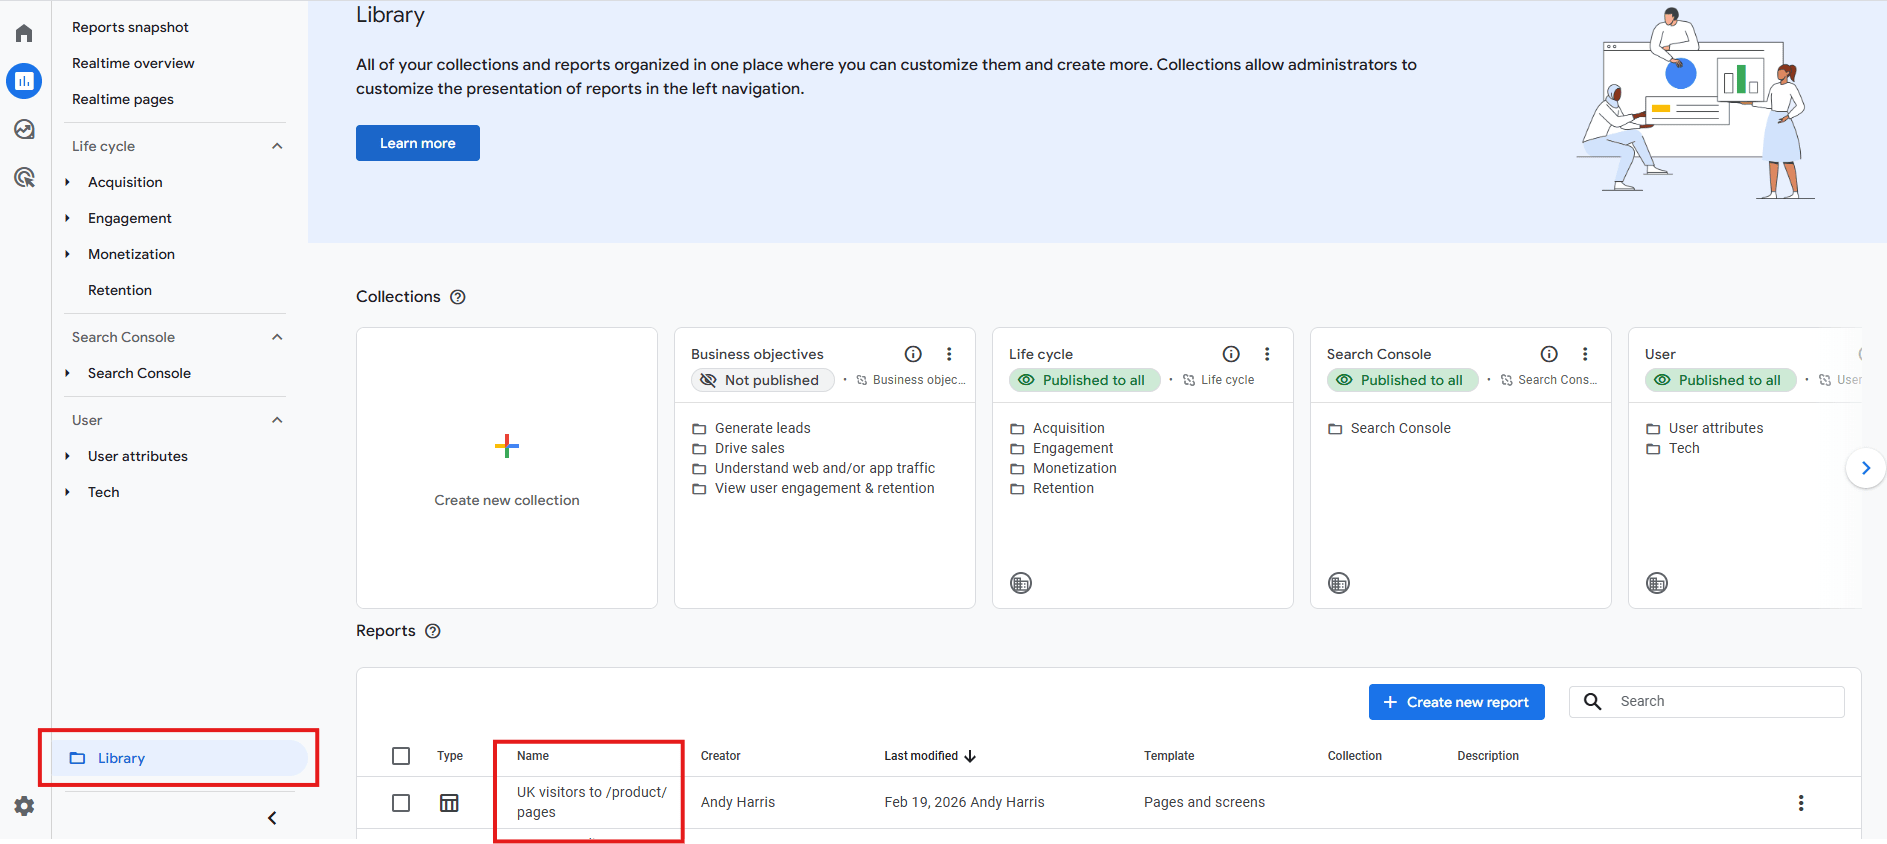
To re-use your saved report in the future, click on Library to see your reports. When you run it in the future you will just need to change the date range.
Users alone tell you very little.
Look at:
Although you’re looking at a broad combination of users, you should still be looking at how well they engaged (or didn’t!) with your pages overall.
I recommend that you give priority to the product or service pages that have the highest levels of visitors from your target country/countries.
You are already getting visitors to those pages and you may also be using paid traffic to get them there.
By comparing enquiries/sales to numbers of visitors to your most popular pages, you will be able to ask yourself the question: what impact would it have if we increased the percentage of enquiries/sales for that?
There will be many reasons why you’ve not got enough enquiries/sales from people in your target geography – now you have your starting point from which to focus on how to improve your results
Google Analytics gives you a rough view of visitors from your target countries but you ideally need to bring in stronger analytics tools to dig deeper into each visitor to those pages.
These include heatmapping tools such as the free Microsoft Clarity, and detailed analytics software that lets you visually see specific patterns.
While there are many heatmapping software providers and some of them have additional features, Microsoft Clarity is free and provides enough insights for most small businesses.
Using Clarity you can filter your website visitors data by country and visits to specific pages and:
This is extremely useful when you’ve gained this information and then want to then micro-analyse in more depth:
Your next step is to get more granular, which Microsoft Clarity is very good at.
Another analytics method of filtering website visitors by country is via the software I provide, which allows you to create a very granular view of visitors.
Here’s an example:
Identify visitors from UK and France, who got to a specific section of a website, but who didn’t get to the deeper level of that website.
You can see how that’s easily done in this video:
You can then take such data and cross-reference it to the dates and times recorded in something like Microsoft Clarity so that you totally absorb how people from those countries interacted with your website.